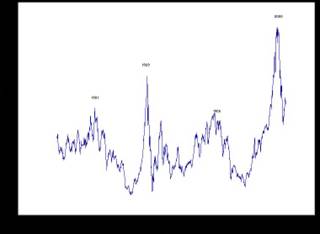
IS THE PRICE EARNINGS RATIO TOO HIGH? (click image to enlarge) 
In Robert Shiller's book, Irrational Exuberance, the above chart accompanies data showing market returns were horrible for 15 to 20 years after major peaks in the PE ratio. For example, the S&P posted average real returns of -0.5% in the 15 years after the 1966 peak. At the end of this 15 year stretch, short interest rates had climbed to 21%.
I was fortunate to buy stocks in 1982 just after the rates started to fall. 1982 was the beginning of a fun time for the big S&P companies. However, the chart and data miss a very important point! Smaller stocks rose an average of 1500% (nominal returns) from 1974 to 1983 which was smack in the middle of the poor returns in the S&P! Those who jumped in near the top lost a bundle in just a few years. Many sold out at big losses by mid 1974. On the other hand, those who bought in '74 made big money right in the middle of this tough tough time.
While it is true that the market climbed a big mountain in the 90's, it is also true that the market took a big hit in 2000, 2001 and early 2002. The P/E ratio came down hard. The current PE is not high relative to bond rates. The rule of 20 demonstrates this point. Using the rule of 20 one subtracts the current yield of the 10 year treasury from 20 to get a fair PE ratio. This measure is simplistic but it works! The S&P is currently fairly valued and my guess is that earnings will grow by 9% in 2005. Nine percent returns are not incredible but they sure beat a 4% taxable bond rate.
Stocks look very attractive! However, if unexpected events should cause interest rates to rise sharply along the curve, my tune would change quickly. The view is beautiful from here; just don't look down!
Friday, December 24, 2004
DON'T LOOK DOWN!
Posted by
Jack Miller
at
12/24/2004 01:06:00 AM
![]()
Subscribe to:
Post Comments (Atom)


0 comments:
Post a Comment